Research Portforlio
Research Interests
Research Experiences
MS in Statistics
University of Chicago
September 2022 - June 2024
Honors and Scholarships:
- GPA: 3.73/4
- 25% Tuition Scholarship of Statistics Master Program (2022, 2023)
Examining the Interplay Between Politicians’ Facial Expressions in Media Images and News Corporation Bias
- Period: Sep 2023 - May 2024
- Reference Information: Chenfeng-Li/Politician-Image-Project
-
Project Description:
This is the thesis for the master degree at UChicago.
Supervisor: Prof. Aaron Schein
In this research, we are interested in whether the news corporations in America tend to use the images of some influencial politicians with different facial expression based on the media bias.
For example, if Donald Trump, the former republican presendent, is portrayed with a more hostile expression in progressive medias (e.g. CNN, Politico) as opposed to a more composed demeanor in conservative outlets (e.g. FoxNews, Washington).
-
My Position:
Independent Researcher
-
My responsibility:
I was provided an dataset with image URLs (fetched from media websites) and text (titles, captions, alternative texts) from eight American news media with different political bias.
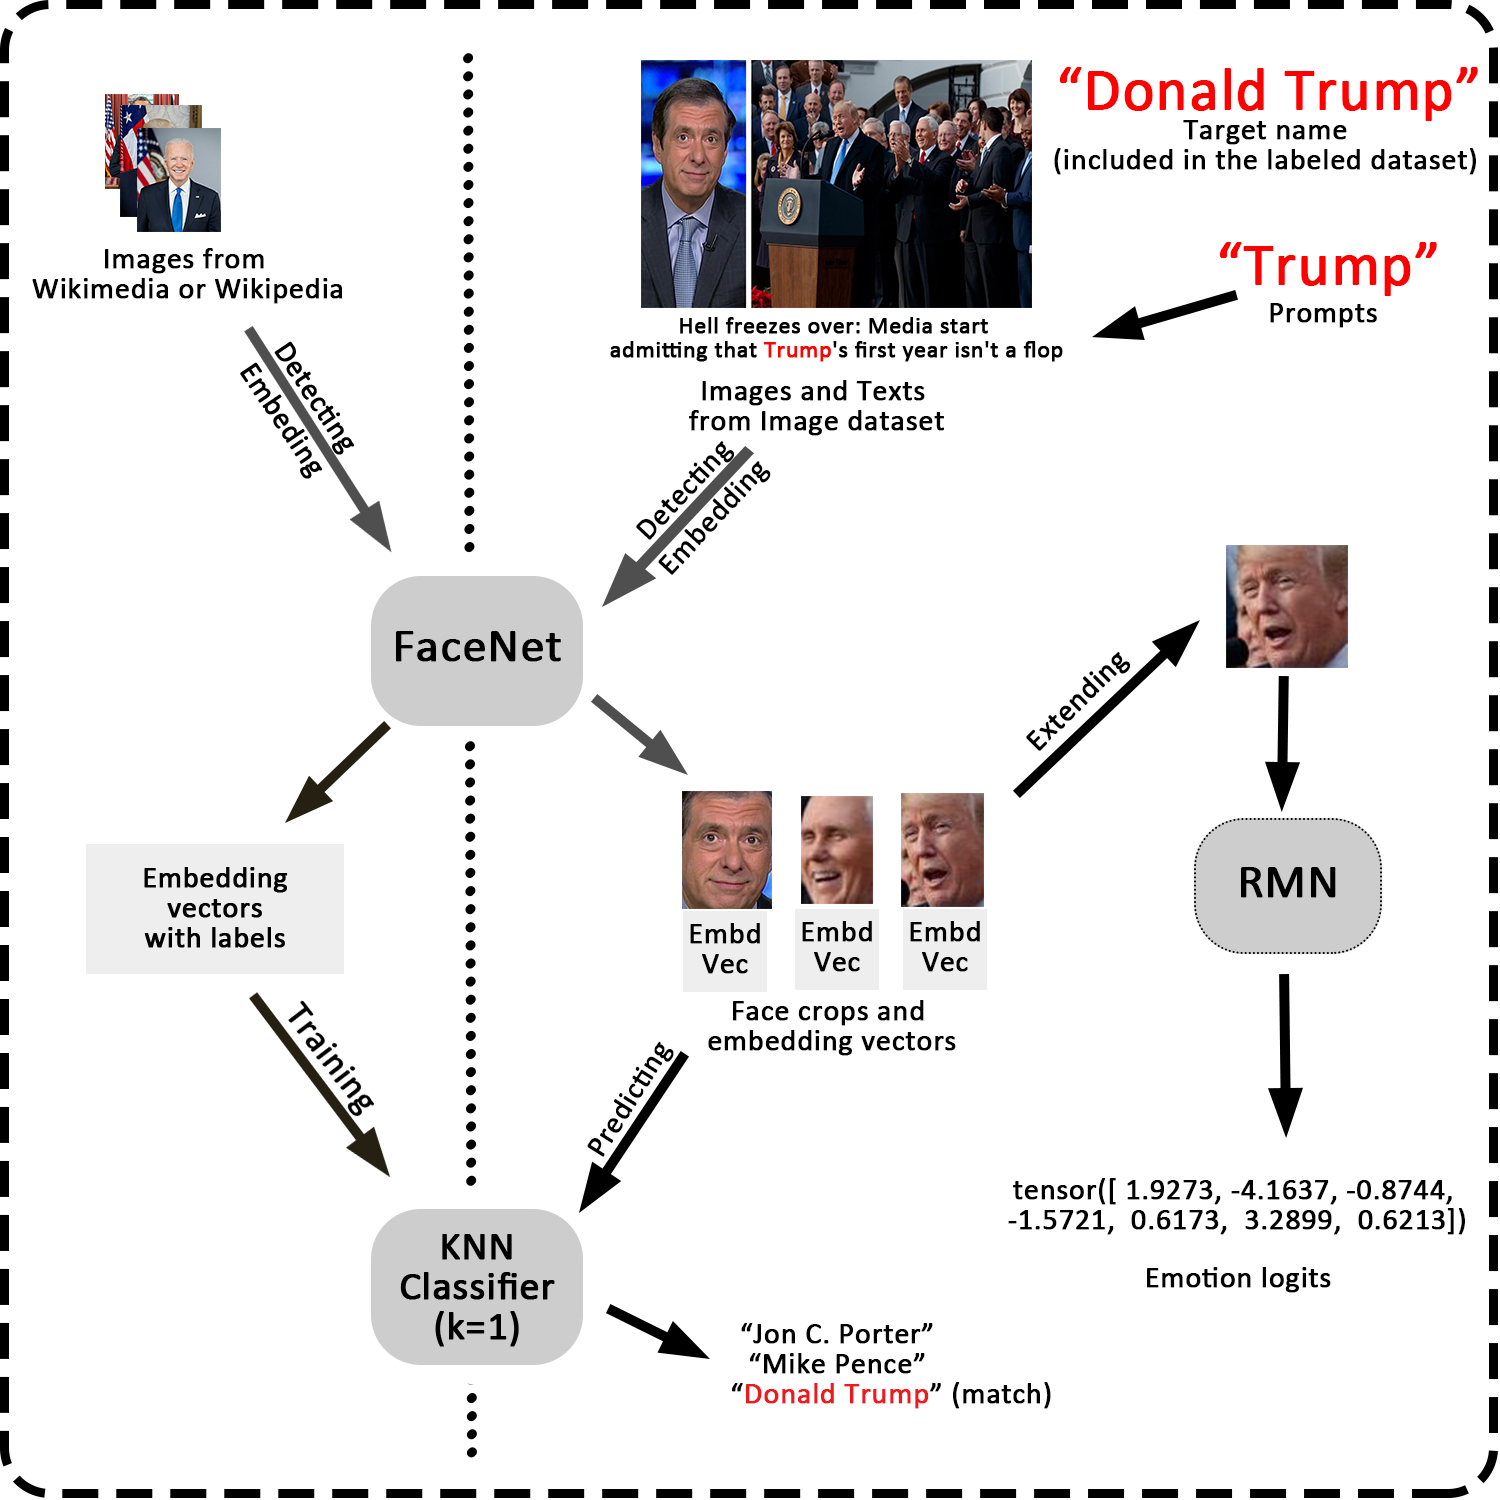
I created a system to recognize the faces from influencial politicians, extract their emotions information, and analyze and visualize the emotions from different news corporations. The basic idea is shown as the nearby picture, please check the Details session and Github repository if you are interested in.
After complement of the analyze, I compiled a 10-page report in LaTeX and made presentation in front of the professors from Department of Statistcis.
-
Details:
I'll briefly talk about the research methodologies and result in this session.
As mentioned above, the dataset contained images URLs (do not necessarily contain faces of politician) and corresponding texts. After cleaning the invalid and duplicate data, we obtain the source of each image from the second level domain of its url.
We made use of two pretrained open source model: FaceNet, an robust facial detection and recognition model, and RMN, a facial expression recognition model. The methodologies contains the following three parts:
- We need to build a name recognition model, which detects if there are faces and who they are for an input image. Therefore, we need a labelled dataset, containing images of politicians' faces and their names. Wikimedia is a proper dataset for this, as it contains some metapages of "21st politicians in United States", where the page of each politician contains a portrait as well as some relevant images of them. For each politician, We passed the portrait through FaceNet to get the "controlled embedding vector", and collected more faces with embedding vector closed to the controlled one. After this process we get the label dataset, then trained a KNN model with \(k=1\) as the name recognition model.
- Then we could work on the media dataset. In this research, we worked on some influencial politicians. Use "Donald Trump" as an example. To increase the efficiency, we specified some prompts, in this example "Trump", and filtered the observations whose texts part contains the prompts. We passed thess images to the FaceNet to get the face crops and embedding vectors, and then passed the embedding vectors through the name recognition model. If some vectors predicted "Donald Trump", we stored the face crops for the next process.
- For the rectangular face crops, we extended it as square, modified the grey scale, and passed the them through the RMN model to get the emotion logits, which are 7-dimensional vectors representing the combination of seven basic emotions. Then we can analyze these logits.
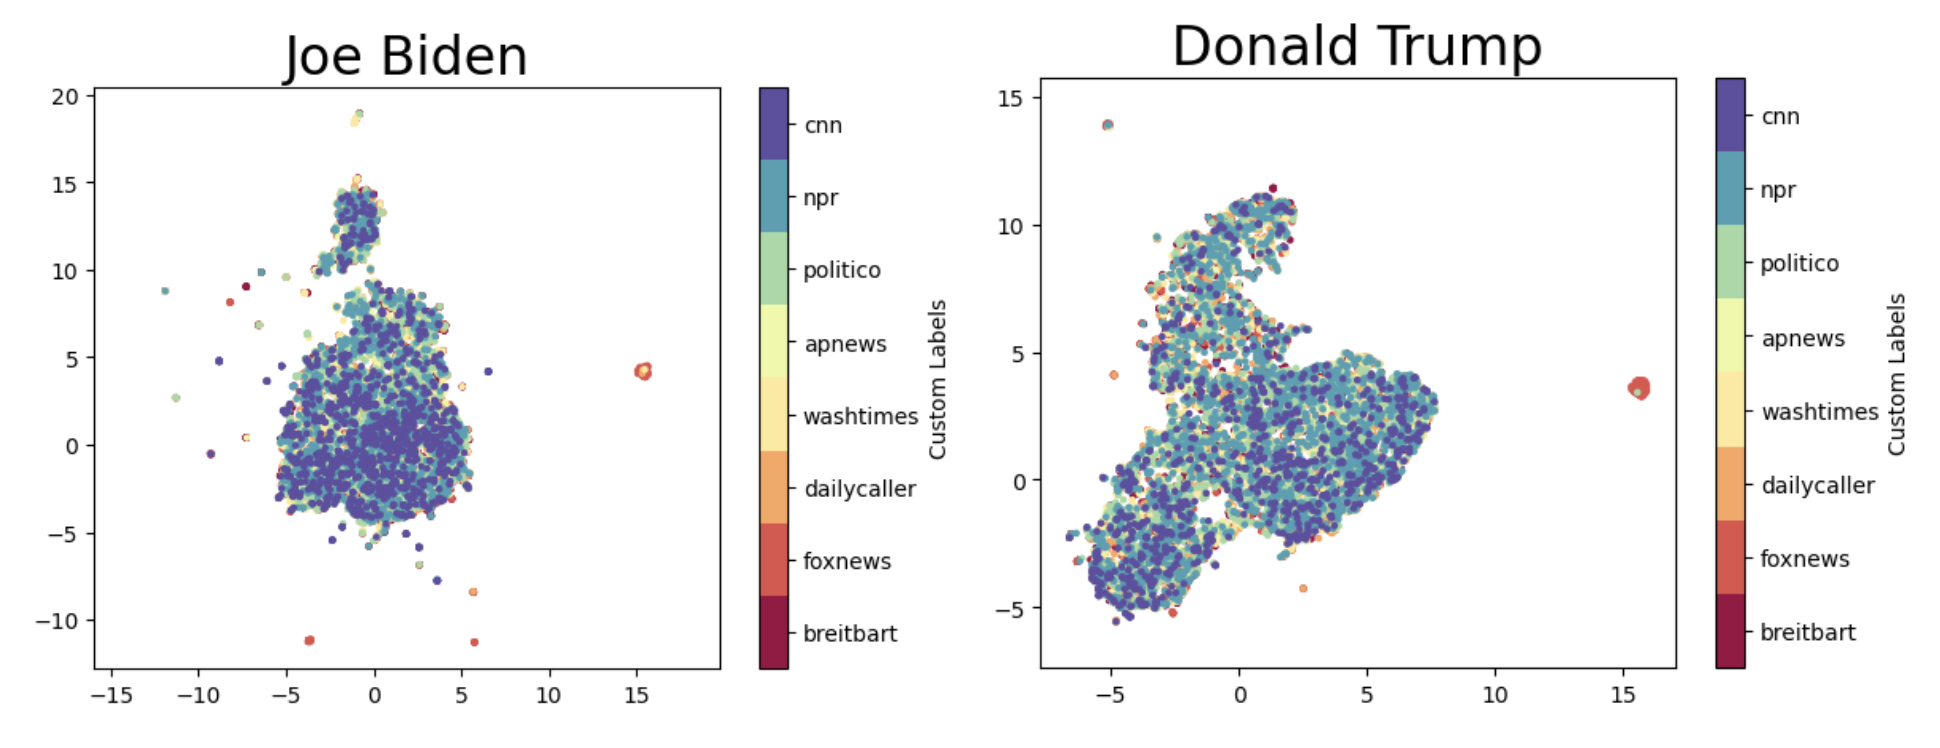
We then analyzed the emotion logits by categorizing them by the eight news corporations and/or the political bias (progressive or conservative). There are two solutions for this problem. The first and intuitive one is to visualize the logits. We implemented the UMAP to reduce the dimension of the logits to 2, and for each news corporation we created a scatter plots with different colour for each politicians. The plots
- The first and intuitive one is to visualize the logits. We implemented the UMAP to reduce the dimension of the logits to 2, and for each politicians we created a scatter plots with different colour for different news corporations or media bias. The above are some examole plots. According to these plots, we could not distingished the emotions based on news corporations
- However, the result after reducing the dimension may not be generalized. Therefore, we built some KNN classifier on the emotion logits with the same idea, and evaluate the models with validation accuracies and confusion matrixes. We found that these models are not necessarily better than the baseline models, which derived a same conclusion that the relationship between politicians' emotion and news corporations/media bias is not significant.
In conclusion, our results indicated that there is no clear relationship between the facial expressions of specific politicians in media images and news corporations or their political bias. Some possible reasons are listed as follows:
- Lack of Deliberate Selection of Facial Expressions by News Corporations, as it may have negative affect on long-term interest.
- Limited Representation of Political Bias Across News Corporations. Eight news media may not be enough.
- Inadequate Representation of Facial Expressions by Emotion Logits. The seven 7-dimensional emotion logits may not represent complex facial emotion well.
- Same expression may have different meaning. An angry expression could be described as irritable and agitated, and in contrast passion and assertiveness.
- The Impact of Timing on Photo Selection. The time of each image is not given, as the rating of a politicans for each media may change over time.
Modified Attention with Non-Linear Kernels and its Impact on Few-Shot Learning
- Period: Oct - Dec, 2023
-
Reference Information:
WilliamsJakeL/LLMProject (where I am an contributor)
Poster at final seminar. -
Project Description:
Collaborated within a three-fellows team.
Trained GPT-2 models on nanoGPT using OpenWebText with replacing the dot product kernel in attention mechanism by Gaussian, polynomial and periodic kernels.
Evaluated the models with MMLU, ARC and Translation tests. Determined that traditional dot product kernels performed best overall, with some non-linear kernels excelling in specific tests.
Produced a poster, share results and communicated with other research teams and instructors at the final seminar.
-
My Position:
Research Team Member
-
My responsibility:
Review the background history of language model and the theories each attention kernels.
Help with modified the attention kernel of nanoGPT model, as Gaussian, polynomial and periodic.
After the four models with different kernels are trained, prepare the AI2 Reasoning Challenge (ARC) and implement the ARC test to evaluate the performance of each model.
-
Details:
The attention mechanism is the key of modern transformer-based language model. It solves the long-term memory problem of the traditional recurrent neural network RNN by parallelly evaluate the relevance of a token with all its prefix tokens.
Within multi-head attentional layer of a transformer, each token has a query \(Q_i\), a key \(K_i\) and a value \(V_i\) vector. Traditionally, we implement dot product \(Q_i·K_j\) to combine the query of current token and the keys of all prefix tokens, then apply softmax function and compute the weighted average of values to get the context vector.
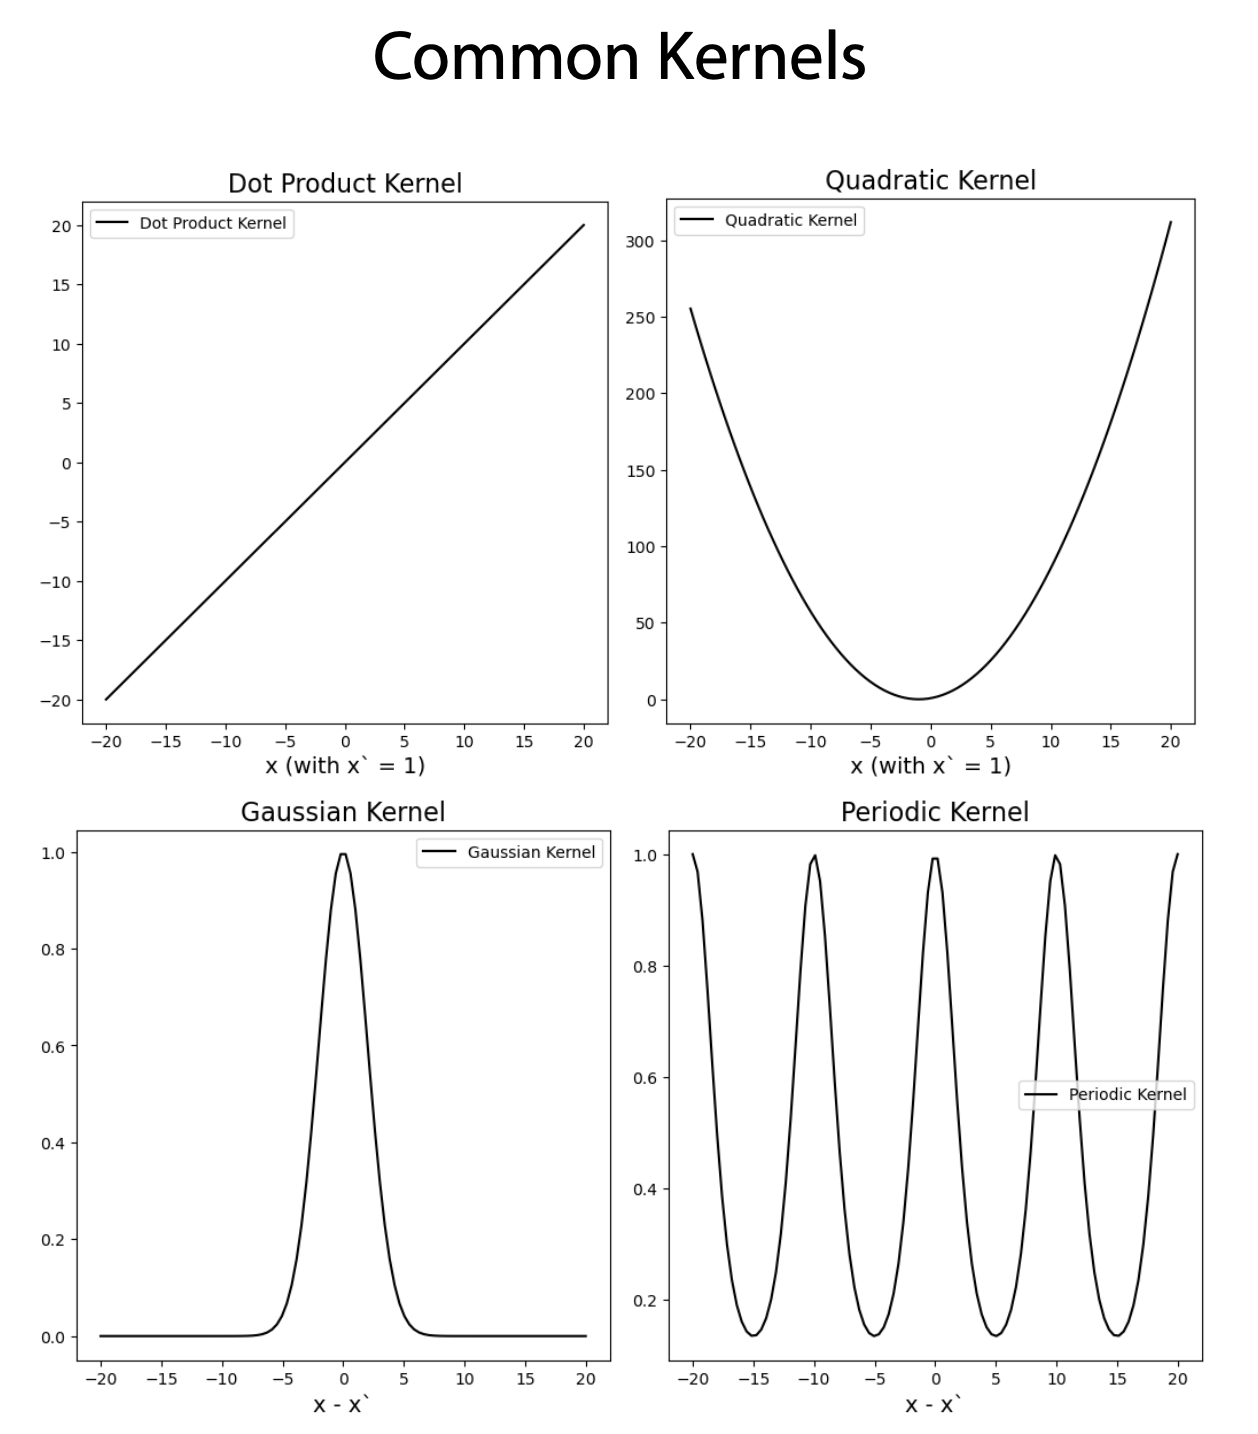
We call the function to combine query and key the kernel function. For example, the above is called the dot product / linear kernel: \(k(\bold{x}, \bold{x'}) = \bold{x}·\bold{x'}\). According to the recent research, other types of non-linear kernels could also be used within the attention mechanism. For example:
- The quadratic kernel: \(k(\bold{x}, \bold{x'}) = (\bold{x}·\bold{x'}+1)^2\).
- The Gaussian kernel: \(k(\bold{x}, \bold{x'}) = e^{-\frac{|\bold{x}-\bold{x'}|}{8}}\).
- The periodic kernel: \(k(\bold{x}, \bold{x'}) = e^{-2sin(\frac{|\bold{x}-\bold{x'}|}{10})}\).
The goal of this research is to study the performance of these kernel function by modifying the relevant codes of NanoGPT, training a GPT-2 with openWebText for each model, and evaluating them with few-shot learning on the language exams: MMLU (Massive Multitask Language Understanding), ARC (AI2 Reasoning Challenge) and English-French Translation.
According to our research, we found that in all the three exams, even though the GPT-2 model with some non-linear kernels has just fine performance in some specific exams, the dot product kernel has a much better performance overall. This result also explains why almost all modern language models (GPT-4, BERT, etc) uses dot product within the attention mechanism.
Robustness to Spurious Correlations via Distributionally Robust Optimization (DRO)
- Period: Apr - May, 2023
- Reference Information: Chenfeng-Li/DRO
-
Project Description:
This is a teamwork of three.
Review the theory of DRO.
Construct a colored MNIST dataset with spurious correlation (which are different between training and testing set). Build ERM (empirical risk minimization) and DRO models with and without regularization, apply to the dataset and evaluate the performance of each model.
Conclude the robustness of DRO model with strong regularization on the dataset and compile report.
-
My Position:
Project Leader
-
My responsibility:
Grouped the team, communicated with members and organized tasks.
Constructed the colored MNIST dataset. Wrote DRO models and apply to the dataset. Made comparison between DRO model with or without regularization and drew conclusion. Evaluate the DRO model with the general case of spurious variables.
-
Details:
For a supervised learning problem, with observed features \(X_1, \dots ,X_n\) and corresponding target \(Y\), we want to use the \(X\)'s that cause \(Y\) and avoid using those caused by \(Y\). We call the correlation between \(Y\) and \(X\)'s caused by \(Y\) as spurious correlations. The models with spurious correlation are possibly made wrong prediction.
The regular model (such as ERM) couldn't handle such problem, and we could consider DRO model. The idea of DRO is to grouped the data based on features, then minimize the risk of the wrost cases. We use colored MNIST dataset as an example.
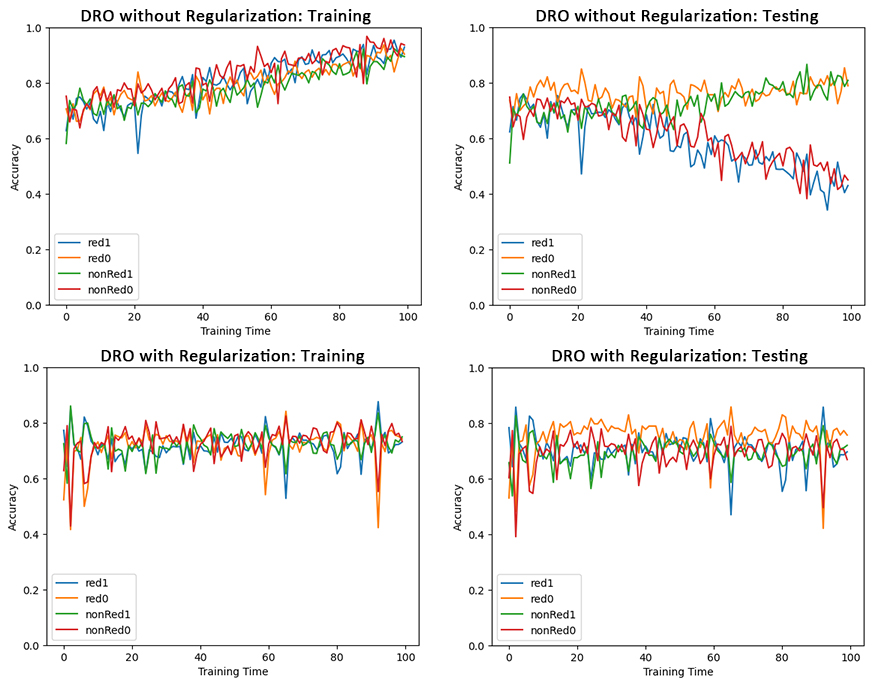
MNIST is a dataset with images of hand-written digits and the corresponding numbers. For each image, label it as \(Y_i=0\) if the digits within 0-4 or \(Y_i=1\) if the digit within 5-9. Then colored the label 0 images with red and label 1 images green. For the training set, flip the color with probability 0.25, while for the testing set, flip the color with probability 0.8.
Under this setting, Image -> Digit -> Label \(Y\) -> Color, where "->" denotes causation, and Image and Color are observed features. The correlation between label and color are spurious. If applying ERM, the model would learn this relationship from training set, but as such causation in testing set are different, the testing performance is poor.
To apply the DRO model, we separate the dataset into four subgroups based on color (red or green) and label (0 or 1). Then train a model that minimize the risk of the group with highest risk. This effectively eliminate the influence of spurious correlation. Moreover, to avoid overfitting, we use DRO model regularization. This model have satisfying training and testing accuracy.
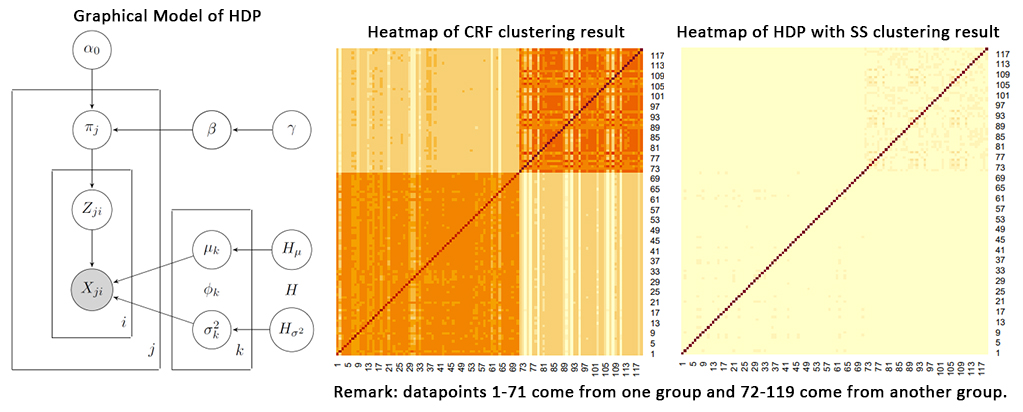
Hierarchical Dirichlet Process (HDP)
- Period: Apr - May, 2023
- Reference Information: Chenfeng-Li/HDP
-
Project Description:
This is a given-topic final research of a Bayesian course. I worked at the stat team of eight.
Review the theory of HDP, Chinese Restaurant Franchise (CRF) and Slice Sampler (SS). Implement CRF sampling method for a clustering problem.
Construct a HDP model and implement SS for the same problem. Make comparison with the result of CRF method.
Make presentation and compile report.
-
My Position:
Researcher
-
My responsibility:
Constructed graphical model of HDP and made mathematical deduction for coding.
Cooperatively encoded the model.
-
Details:
Slice sampler (SS): For a probability distribution \(f(x)\) with two or more peaks, and small function value in between, some sampling method (such as Metropolis–Hastings algorithm) may keep sampling values around one peak and ignore the others. Slice sampler is available for this situation. SS is an MCMC algorithm. For an initial \(x_0\), it first uniformly sample a value between 0 and \(f(x_0)\), then uniformly sample \(x_1\) from \(\{x|f(x)>f(x_0)\}\), and repeat this process.
Chinese Restaurant Franchise (CRF): This is a generalization of Chinese Restaurant Process (CRP). In CRP each step choose either one of existing parameters or sample a new parameter. In CRF, it assumes an amount of Chinese restaurants sharing same distribution of parameter.
Hierarchical Dirichlet Process (HDP): This is a expansion of Dirichlet Process (DP), which is an nonparametric Bayesian. In HDP, we set a prior distribution for the base distribution of DP to reflect its variation. Therefore, HDP is more flexible than DP but more computational expensive.
In this research, for the clustering problem from the same given dataset, the performance of CRF is better than the HDP with SS.
Statistical Consulting
- Period: Sep - Nov, 2022
-
Reference Information: Chenfeng-Li/Consulting
Official Page: Statistical Consulting Program (Friday Team in Autumn 2022) -
Description:
Consulting team of five. Provided consulting services to local clients with data issues.
Review the materials from clients after receiving the consulting request. Meet with them online and discuss detailed concerning of the problem, and provide brief suggestion instantly.
Delivered the final reports to clients. Make presentations to instructors and other consulting teams.
Completed three consulting missions duriing the period.
-
My Position:
Consultant
-
My responsibility:
Participate in the whole consulting process.
-
Details:
First client is Mr. Kwang from UChicago Medicine. This client wanted to study the effect of a medication for COVID patients on the requirement of ventilation. We advised to apply logistic regression, and provided suggestions on grouping the patients and strengthen the analysis result.
Second client is Ms. Wang from UChicago BSD. This client wanted to study the effect of HCBS (a kind of health-care service) on Post-Acute Care (PAC) based on a dataset with 700,000 observations, and she was interested in using fixed effects (FE) with propensity scores (PS) weighting in the model. We suggested to use logistic regression model without PS weighting.
Third client is Ms. Gan from UChicago Medicine. This client wanted to learn if the distance between the middle point of the chest and left entricle is significant accross different age group and other physical factors. We pointed out an issue of the covariate choice (BMI should not be included as it is a function of weight and height), advised linear regression model and provided the number of samples should be collected.
Bsc in Mathematics
Chinese University of Hong Kong (CUHK)
September 2018 - July 2022
Honors and Scholarships:
- Bachelor of Science with Honours, First Class
- GPA: 3.63/4; Major GPA: 3.73/4
- Undergraduate Mathematics Scholarship (2020)
- Chung Chi College Award for Mathematics Resident Students (2021)
- Chung Chi College Class Scholarship (2019)
The current situation and feasible development direction of Chinese medicine
- Period: Jun - Dec, 2021
- Reference Information: Chenfeng-Li/Chinese-medicine
-
Description:
Teamwork of four for the capstone project at the Chung Chi College, CUHK. The language of this research is Chinese (traditional).
This research is to study the situation and problems encountered of the Chinese medicine, and raise suggestions for its development.
The research process included reviewing relevant papers, interviewing specialists and practitioners, collecting and analyzing the public preception through questionaires, and further discussion about development. Then we compiled reports and made presentation.
-
My Position:
Data Analyst
-
My major responsibility:
Review the research related to public preception about Chinese medicine.
Design and distribute online and paper-based questionaire. Process regression analyze and visualize by charts. Draw analysis conclusion and make reflection.
-
Details:
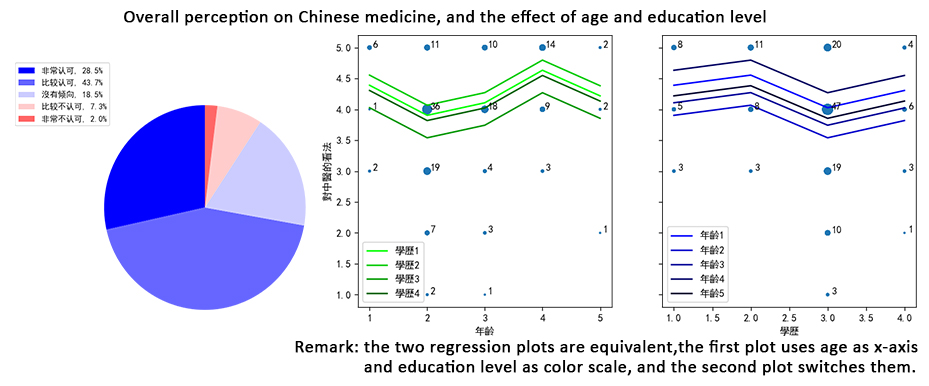
In general, we analyzed the medical, econimical and cultural value of Chinese medicine and concluded that it is worth developing. According to the data result we noticed that the public have positive view in Chinese medicine. However, the Chinese medicine faces many issues, such as non-scientific theory, treatment effectiveness, qualify of products and lack of talent. We raised suggestions such as pharmacological analysis, patent protection, commercialization.
In data analysis part, I wanted to study the effect of ages and education level on the idea of Chinese medicine (overall, theory, effectiveness and choice), and the perception of some specific symptoms, the advantages and shortages of Chinese medicine. Therefore, I designed a questionaire with 10 questions (required 1-2 minutes to finish), and distributed online and on-site with the help of teammates.
We collected 153 valid answers. I used linear regression on the first problem. As the ages and education level were ordinal categorical variables, and to analyze the difference between each two neighbor categories, I encoded with staircase dummy variables. The result showed that generally, the age had positive effect ,and education level had weak negative effect on perception. Besides, I found people thought Chinese medicine is more effective in treating minor and chronic diseases.
The limitation in this analysis is that the sample size is small, especially for the elderly group, and many people rejected to answer, which may cause bias on result. Besides, we can choose more covariates (such as income level).
A General Review of Facial Recognition Technology
- Period: Sep - Dec, 2020
- Reference Information: Chenfeng-Li/Facial-Recognition
-
My Position:
Independent Researcher
-
Description:
This is an independent project.
Review the theories and applications of several facial detection and recognition methods proposed in the past decades.
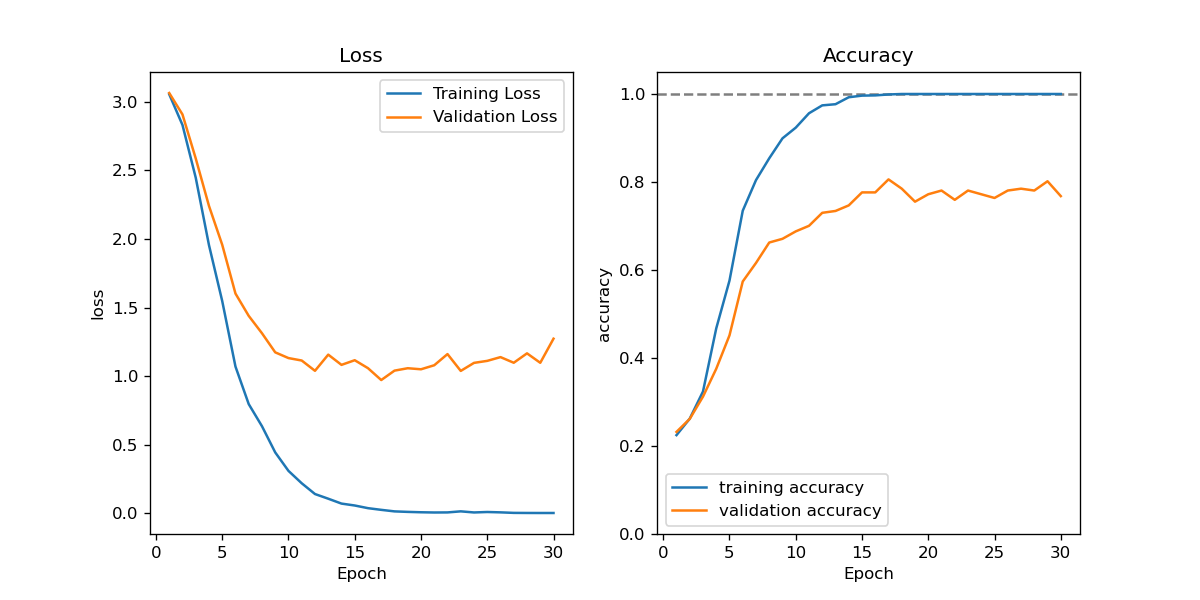
Implement a facial recognition model through Convolution Neural Network (CNN).
-
Details:
This is my first research project, when I was new on machine learning.
I divided the review part into two, detection and recognition. In detection part I provided some personal thinking and reviewed Viola-Jones Algorithm, CNN and Multi-task Cascade Convolutional Network. In recognition part I reviewed Eigenface and CNN.
In the inplementation part I chose a dataset with 2,370 face images (of size 50*37) from 34 individuals from Sklearn (fetch_lfw_people with 30 minimum faces, resize = 0.4), and then constructed a CNN model through tensorflow. Split the data with training, validation and testing sets at a ratio 8:1:1. Achieve a testing accuracy of 80.6%.